


Kickstarter 2009-2017 Data Project
Analysis of trends in Kickstarter data set provided by Maven Analytics.

Table of Contents
Problem Statements and Solutions
Question 1
Question 2
Question 3
Question 4
Abstract
Kickstarter is a global crowdfunding platform that began in 2009, facilitating the transfer of billions in funding from interested consumers to inventive product proposals in exchange for rewards and perks upon product release. In the data provided, from the 2009 launch to the first days of 2018, we have at our disposal over 300,000 project proposals to determine what factors have been most important to a project’s success on Kickstarter. During this analysis, we came to the understanding that both entertainment and inventive household products tend to be the best performing projects, which rank highly on the average success rate and goal completion rate of any given project in those subcategories. We also discovered that some subcategories which have high observed figures for these two metrics may be adversely influenced by a low total number of projects, with a handful of well-known projects pulling the averages for these low-volume subcategories.
Assembling the Data in the SQL Environment
The data set that was utilized for this project, along with the four problem statements, were originally found on Maven Analytics.1 The code and csv files for this project can be found at the corresponding GitHub repository.2 During the table design process, to make sure there were no omissions from the data, the NOT NULL constraint was added to each table column in order to test for errors during import that would indicate incomplete data. When the import executed without a hitch, I knew that the data contained no NULL cells and was complete. Through the course of this project, when a date is referred to in the queries for the problem statements, the project launch date was used as opposed to the project end date. The queries provided in the GitHub were formulated in such a way where this analysis could be easily expanded if the inclusion of Kickstarter’s post-2017 data were possible in the same format.
Problem Statements and Solutions
The following questions were taken from prompts provided by Maven Analytics along with the data set. Additional analysis was undertaken to derive deeper insights into Kickstarter projects from the perspective of an investor looking to find product start-ups with the lowest possibility of failure.
Question 1: Which category has the highest success percentage? How many projects have been successful?
To derive more meaningful information from the data, subcategories rather than categories were analyzed due to varying amounts of success rates between subcategories within the same category. The subcategory with the highest success percentage was Chiptune Music. Chiptune Music projects had a 77.14% success rate, with 27 out of 35 projects being successful during the 2009-2017 period covered by this data set. These results appear to be somewhat influenced by project subcategories with a low number of entries that potentially had large pre-existing followings before launching on Kickstarter. To adjust for this, the HAVING clause was added to exclude subcategories with less than 100 successful projects. When excluding subcategories with less than 100 successful projects, Anthology Comics takes the lead. Projects in the Anthologies-subcategory/Comics-category had a 74.81% success rate and 303 out of 405 projects were successful, a much more comforting record of success.

Question 2: What project with a goal over $1,000 USD, had the biggest Goal Completion % (Pledged / Goal)? How much money was pledged?
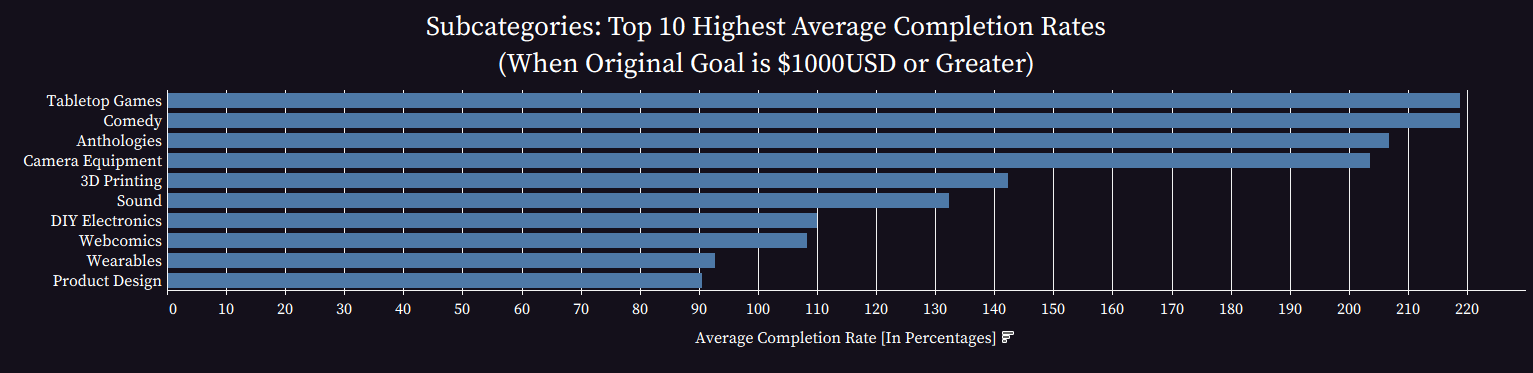
A Tabletop Game known as "Exploding Kittens" had the highest goal completion percentage with total backing being 87,825.72% of goal. This represents a funding total of $8,782,572 from 219,382 different backers! The top 10 projects ranked with a goal of more than $1,000 are ranked by Goal Completion Percentage below. All of the results in the top 10 appear to be Tabletop Games and inventive household products. This caused me to wonder what Goal Completion Percentages were when averaged by subcategory since three subcategories dominated the top 10 when looking at individual projects.

An analysis is in order to find average Goal Completion Percentages when sorted by subcategory for projects that have a goal exceeding $1,000. Looking at the top 10 subcategories, it does appear that Tabletop Games do very well on Kickstarter with an average Goal Completion Percentage of 218.87% out of projects with a goal of more than $1,000. In the other subcategories, we find entertainment products such as Comedy (218.7%), Anthologies (206.7%), and Webcomics (108.37%) as well as tangible products such as Camera Equipment, 3D Printing, Sound equipment, DIY Electronics, Wearables, and Product Design. Categories that had a high average Goal Completion Percentage but low amount of total projects were excluded due to a small number of projects (less than 100 total) influencing the average to the detriment of this analysis such as the following: Publishing - Letterpress (259.03%) and Music - Chiptune (256.37%).
Question 3: Can you identify any trends in project success rates over the years?
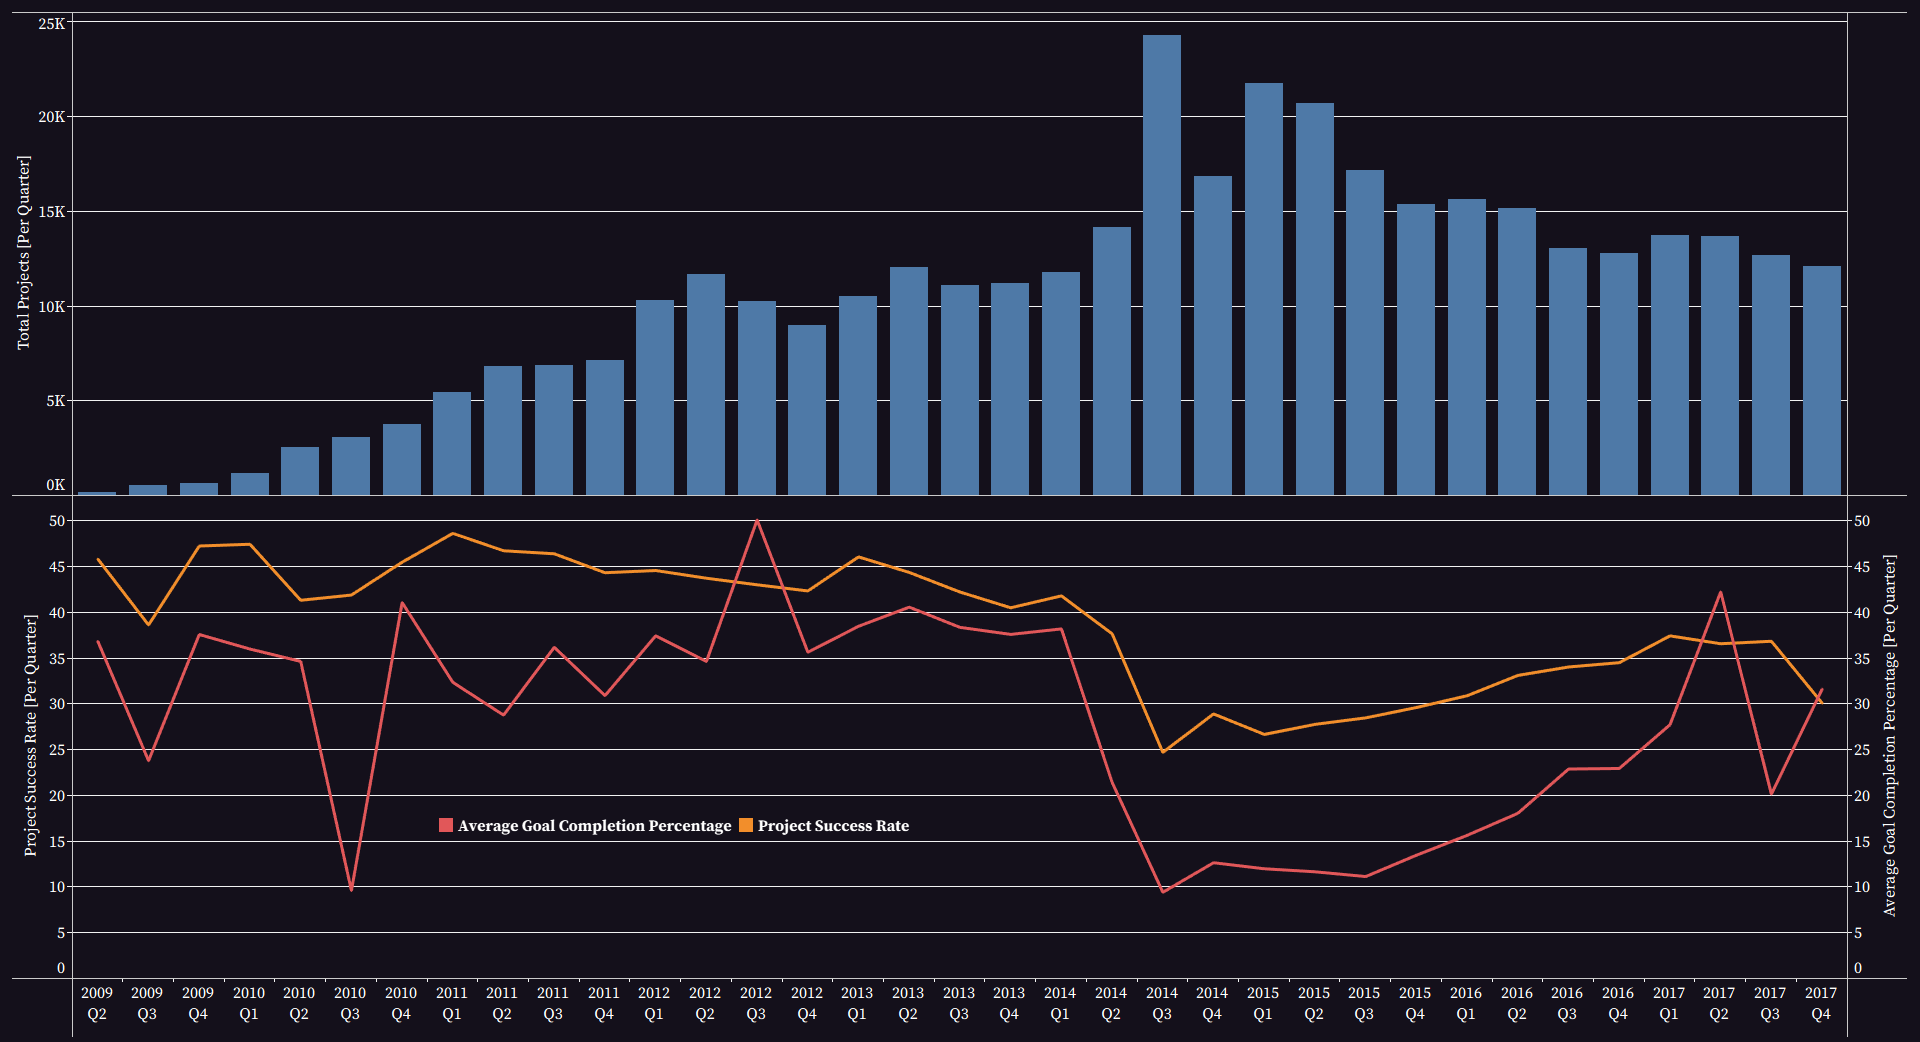
For the purpose of this question, we will evaluate Kickstarter’s performance on a quarterly basis using the project launch dates. As for total projects hosted on the platform, we find steady growth during the company’s first 3 years, then consistent service of between 10-15k projects per quarter until Q3 2014, where a large spike to nearly 25k projects occurred in that quarter. Following Q3 2014, total projects per quarter then began a slide back into the 10-15k range by Q3 2016 through the end of the data. The 2018 data included in this data set was omitted because only the first week of that quarter was included and had no successful projects during that period.
Previous metrics from Questions 1 and 2 were also analyzed over time, aggregated by quarter rather than subcategory to discover trends in relation to total projects data previously mentioned. Average Goal Completion Percentage and Project Success Rate appear to loosely follow one another based on the lower figure in the visulatization below. We can also observe that the red line representing Average Goal Completion Percentage is more sensitive to subtle fluctuations in core indicators, such as total projects. We can see that during the rapid adoption of the platform that occured in 2014, our metrics of Average Goal Completion Percentage and Project Success Rate cratered to all time lows while total projects per quarter soared. This rapid adoption of the platform during 2014 may have seen the influx of a large amount of poorly promoted or designed project proposals that were rejected by the consumer and failed. After this period, we see the opposite occuring. Total projects steadily decreasing with our metrics of Average Goal Completion Percentage and Project Success Rate returning to where they were prior to 2014. Not quite recovered completely, but trending upward in the direction of pre-2014 metrics.
Question 4: As an investor, what types of projects should you be looking at to guarantee future success?
Looking for the safest subcategories as an investor, I brought down the secondary query I wrote for Question 2. This time, I got rid of the filter that excluded projects that had a goal of less than $1,000 to see what the average Goal Completion Percentage is for all projects in the subcategory. I utilized a HAVING clause to find only project subcategories with a 100% or greater average Goal Completion Percentage. I paired AND with the HAVING clause to also filter out any subcategory with less than 100 projects. This was done to filter out obscure subcategories that may have a handful of renowned projects skewing the average, which I pointed out earlier as being a potential problem with Chiptune Music and Letterpress. The results are contained in the visualization below.

The following subcategories have been identified using this methodology as being the safest categories using all of the metrics covered throughout this analysis:
Tabletop Games - Games
Camera Equipment - Tech
Anthology - Comics
3D Printing - Tech
Typography - Design
DIY Electronics - Tech
Webcomics - Comics
Given that it is the only subcategory that appears in both the top 10 Success Rate from Question 1 and top 10 average Goal Completion Percentage in the visualization listed above, Anthology Comics appear to be the safest subcategory on Kickstarter. Anthologies boast an average Success Rate of 74.81% and an average Goal Completion Percentage of 146.3% with 405 total projects over the period covered by the data set.
