Querying an API Using Power BI
Demonstrating a Basic API Connection Using the Fake Store API
In the spirit of constant learning, I have recently made the leap from Tableau to self-study in Power BI. The first shock that immediately struck me was how much more intuitive Power BI was despite my lack of experience with it. I suppose this might be due to Power BI’s similarities to the Microsoft Office suite in how its menus are structured, but I will certainly be using this tool more frequently with this realization behind me.
For the purpose of this demonstration, I will utilize the Fake Store API. It is a simple and free to use rest API meant for testing.
To query the API, we start with the Get Data feature under the Home tab and select Web. This will bring up a menu titled “From Web”.
For the purpose of this demonstration, only the basic web query feature was needed. Your mileage will vary based on what API you are using and what data you are querying using the API, so be sure to read the documentation for the API you are using and maybe test the connection in a different tool, such as Postman.
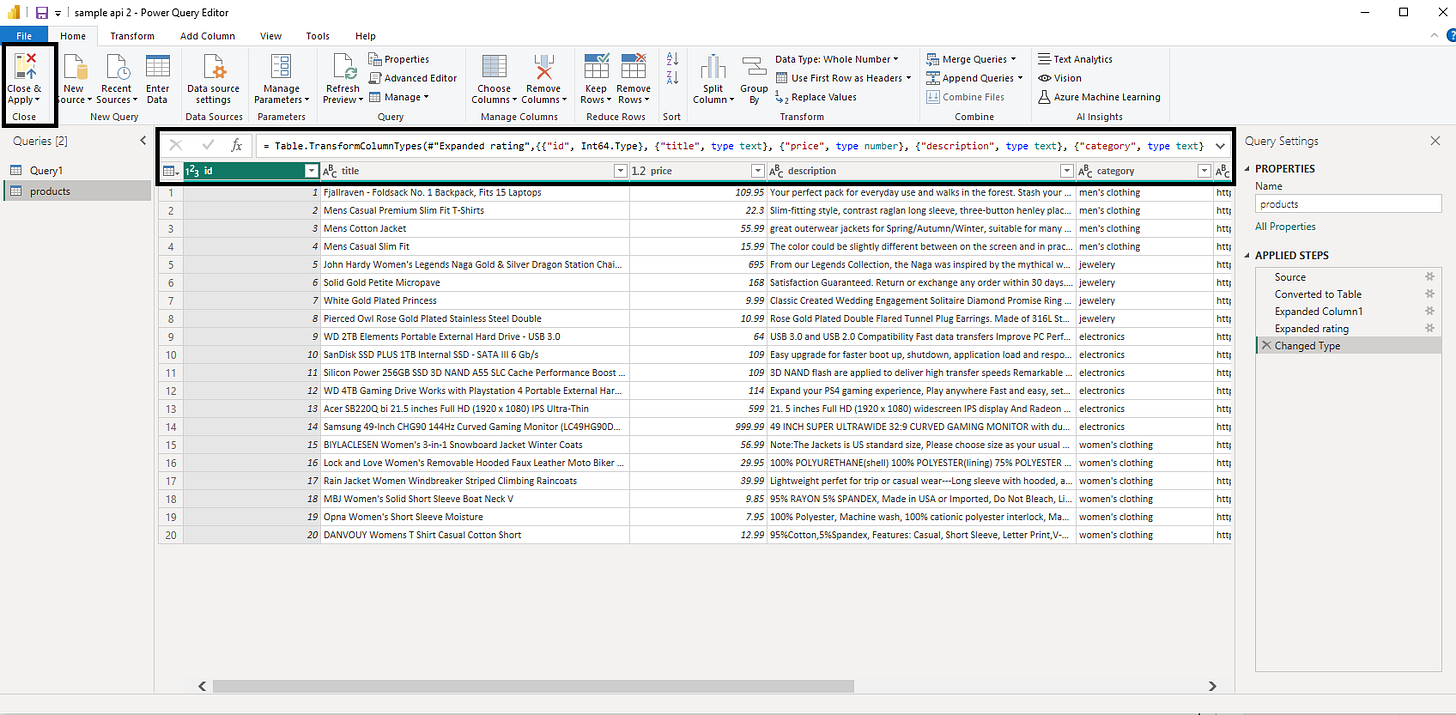
If the connection is successful, the Power BI Query Editor will appear with the relevant data. From here, the connection to the API can be further modified with a preview. This can be done either through the text editor or the column filters. When complete, hit “Close & Apply” in the top left to save the query as a usable data source for building dashboards and reports in Power BI!
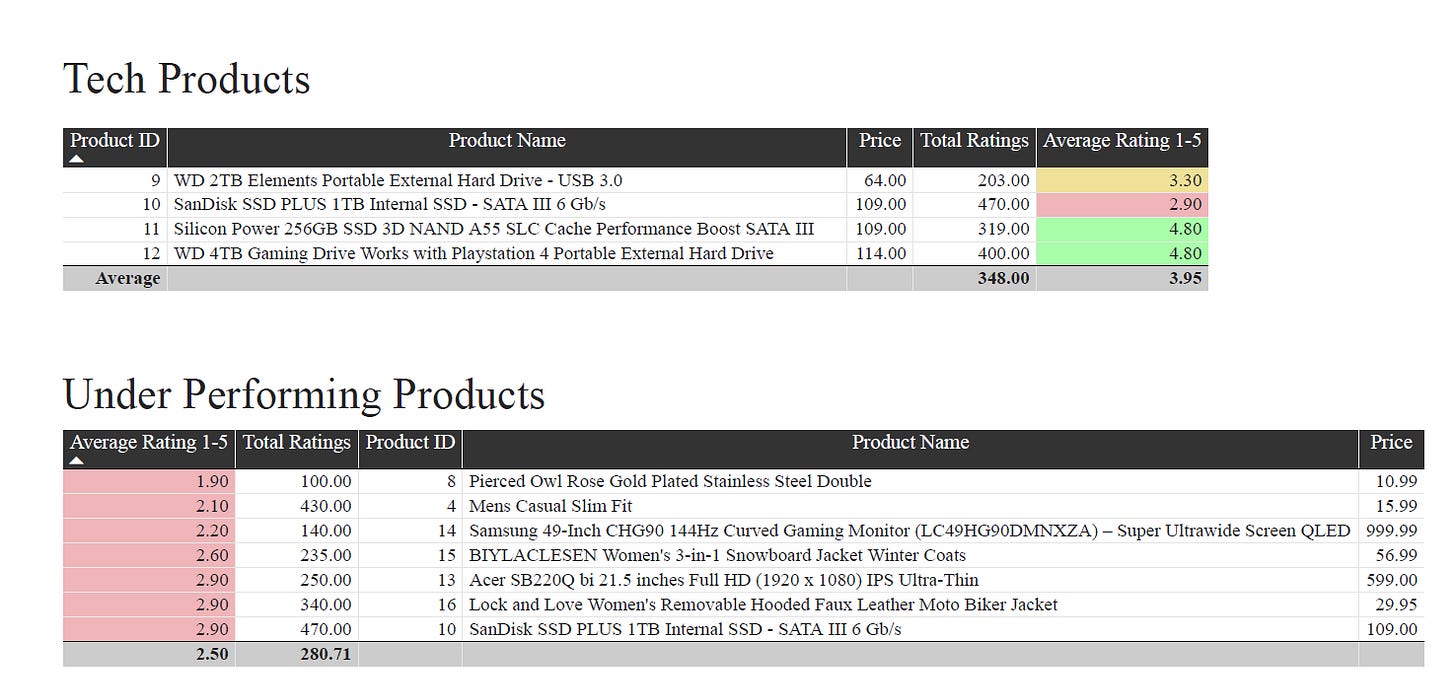
Once complete, I created a basic dashboard that shows the performance of tech products and the worst performing (< 3.0 rating) products from the fake e-commerce listings on the Fake Store API. To do this, I was able to utilize sorting, conditional formatting, and column averages, as well as aesthetic formatting features.
I hope you enjoyed this demonstration! Please leave a like, feedback, or subscribe by email for more business intelligence-related projects and tutorials as I continue to hone my skills!


